
Performance depuis la création (31.10.2018) = -3,50%
Performance 2019 = +4,0%
Performance 2018 = -7,2%
Potentiel moyen pondéré du portefeuille = +200,5% (+5,5 pts depuis le dernier reporting)
Plus d’informations sur le portefeuille daubasses 2 en suivant ce lien.
Fonds propres (moyenne pondérée) du portefeuille et comparatifs : 0,41x

Portefeuille complet en 2 parties :
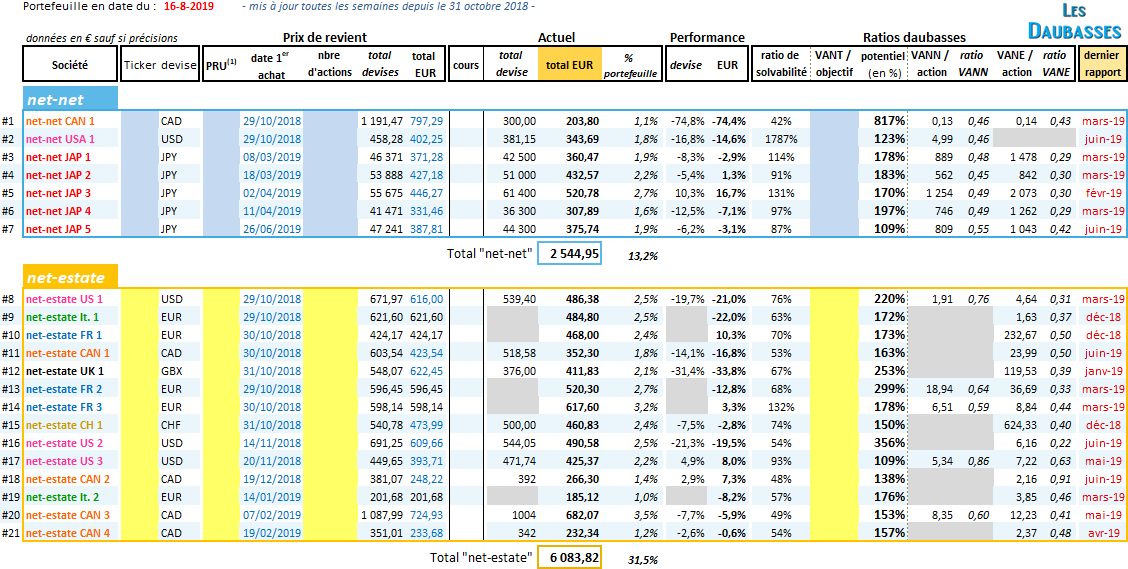
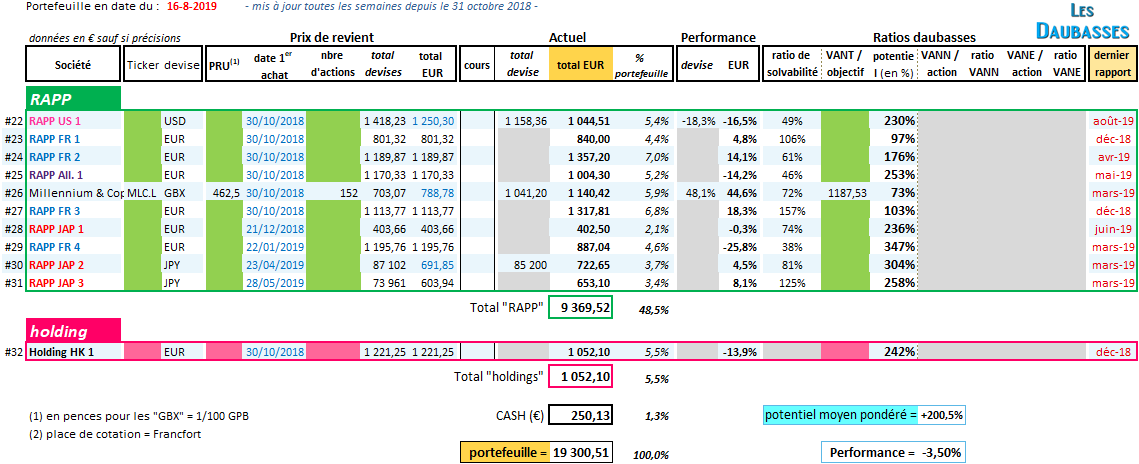
(cliquez sur les images pour les agrandir)
—
Abonnez-vous pour avoir accès au portefeuille entièrement dévoilé.
Opération(s) de la semaine :
– aucune opération –
Commentaire :
Et si le pétard mouillé était finalement pas si mouillé ? Et si la mèche était finalement allumée depuis Hong Kong ?
La petite étincelle. A peine visible sur la scène internationale 2019, mais suffisante pour mettre le feu au tas de poudre bien entassé et accumulé depuis quelques années : endettement des états, taux négatifs pour de plus en plus d’États, ralentissements de la production industrielle au sein de nombreux pays dont l’Allemagne, notre ex-champion européen !
Alors, on prie, on croise les doigts. Avec les actifs détenus en collatéraux au sein du portefeuille et la gamelle ramassée depuis les dernières semaines, difficile de croire qu’un bras de baisse est encore possible. Mais il ne faut jamais , ô grand jamais !, sous-estimer la puissance de Mr le Marché dans ses excès.
Bon weekend et bon retour aux investisseurs qui reviennent de vacances : après les vagues à la plage, voici les heures des vagues en bourse. Attention à la houle !
Hello,
Have you guys encountered this kind of situation as follows before?
– Bought a company, a net net type (VANN) as company has lots of cash in it.
– Price is trading at 70% of VANN, that’s why we bought it.
– Industry in which the company is in is currently facing headwinds (overcapacity), that’s why company price is that low.
– During the year, management decide to use the cash to buy « Plant and equipment ».
– As the cash is used to buy « Plant and equipment » instead of « Property », this investment will no longer be 70% of (1) VANN and (2) VANE
Note: Solvency ratio (as defined by « equity / (total liabilities – cash and cash investments) » ) in this case will change since cash changes
– Besides that, during the year, quarterly and half yearly report shows that the company is now barely breaking even (earnings has worsened compared to last year report which we used it to calculate VANN)
Qualitatively speaking, what the management did to expand capacity may seem reasonable since companies that can’t withstand the loss will exit the industry. And by expanding, it can grab more market share in future (this reasoning may be debatable).
In this situation, will you all still stick to the sell rule of (1) VANT or (2) Solvency ratio <= 40% ?
Because, there may be a chance that it may be the bottom of the business/industry cycle.
By selling it, we may be forgoing the potential profit.
Or what will you all do in this case?
Thank you!
Hi Jx,
In case of :
(1) stock trading at a price > VANT = SELL
Never forget to buy very cheap (regarding the net asset) and to diversify. Do not be afraid having a lot of cash in case of no bargain in view.
(2) Solvency ratio <= 40% (and VANT > current price), the company has a 12 months delay to improve its balance sheet. Else, it is a SELL.